Malaysian Association of Technical Analysts | Technical Analysis Professionals Malaysia
(Estimated Reading Time: 10–12 minutes)
What Is Technical Analysis?
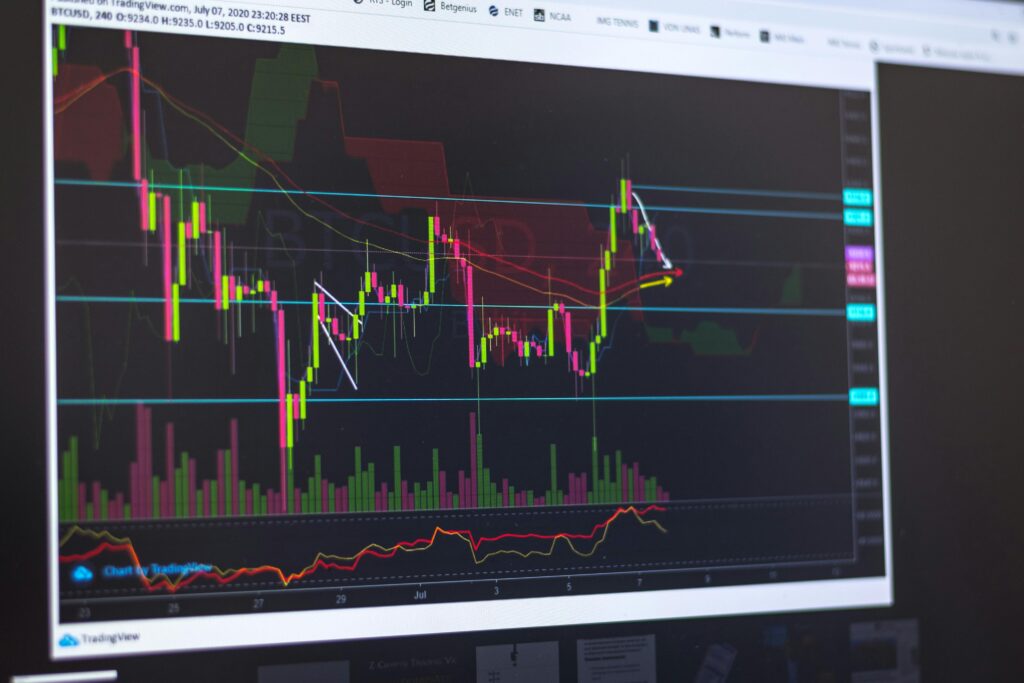
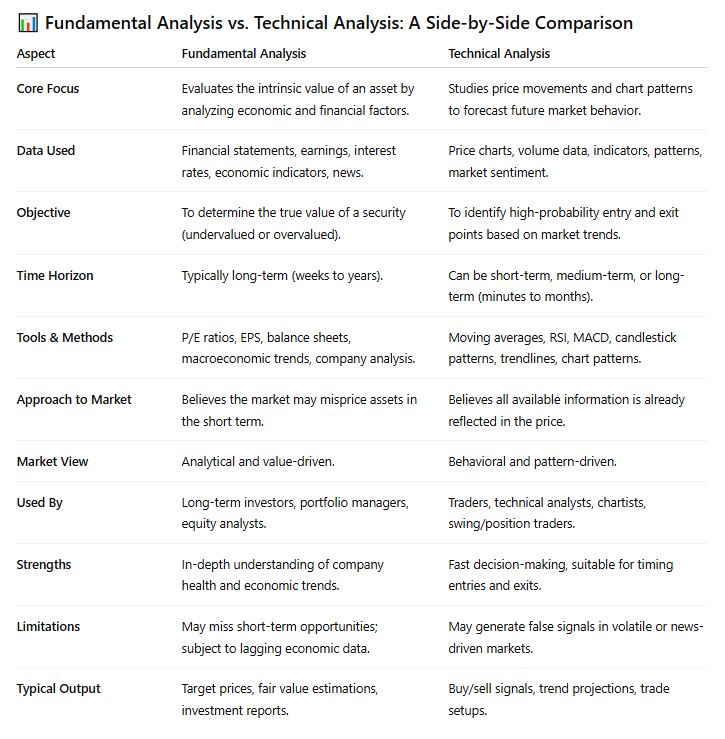
Technical analysis is the art and science of predicting future price movements based on past market data — primarily price and volume. Unlike fundamental analysis, which evaluates a company’s value based on financial statements and economic indicators, technical analysis focuses purely on what the price is doing and how traders are behaving.
In simple terms:
“Technical analysis helps you understand what the market is doing, not why it’s doing it.”
This approach is widely used in trading stocks, forex, cryptocurrencies, commodities, and indices. Whether you’re a beginner or a seasoned investor, technical analysis can help you identify trends, time your entries and exits, and make smarter, data-driven decisions.
Why Use Technical Analysis?
Here are a few compelling reasons why traders rely on technical analysis:
 It’s visual: You see patterns and trends directly on price charts.
 It’s timely: It focuses on real-time price action, not outdated financial reports.
 It’s adaptable: Works across all timeframes — from 1-minute charts to monthly timeframes.
 It’s powerful for timing: You can better decide when to enter or exit a position.
 It includes psychology: Charts reflect crowd behavior, fear, greed, and emotion.
History of Technical Analysis
Most traders know candlesticks, indicators, and chart patterns.
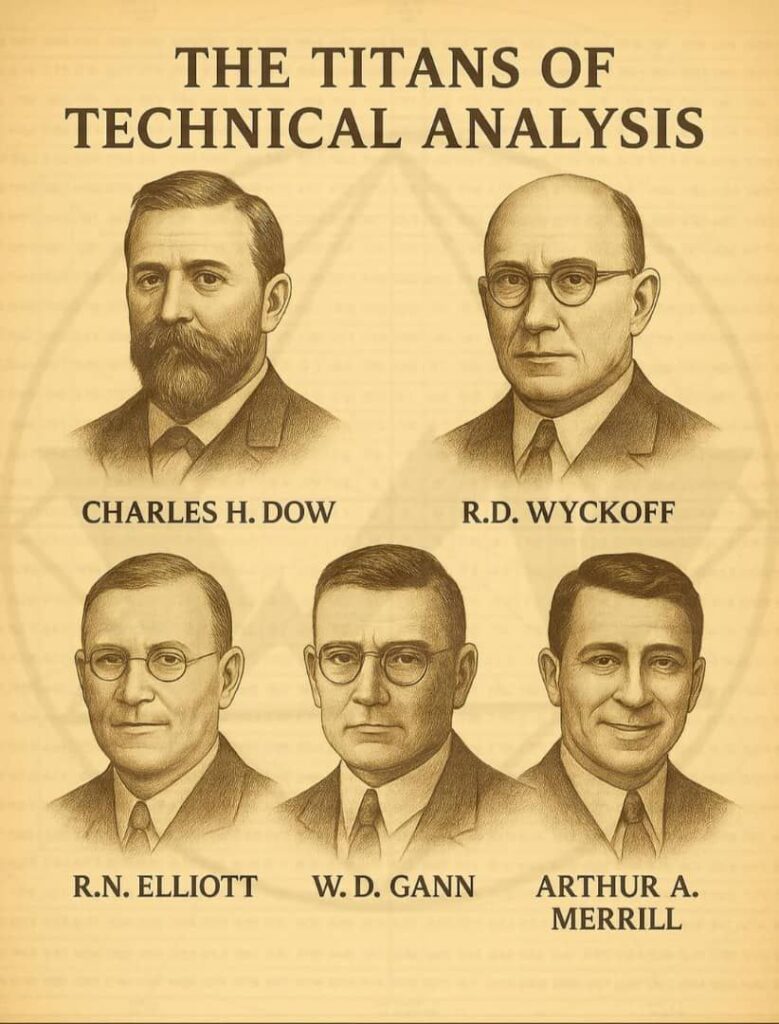
But did you know there are five giants who built the foundations of how we read markets today?
Meet Dow, Wyckoff, Elliott, Gann & Merrill.
An article by David Penn in Stocks & Commodities (2002) gives a great overview of these legends. I’ll drop the link in the comments.
Let’s break it down:
 Charles H. Dow (1851–1902)
Main focus: Market trends.
Dow believed markets move in three waves — big (primary), medium (secondary), and small (minor).
Through his famous Dow Theory, he showed that the stock market reflects the whole economy.
He also emphasized confirmation: for example, industrial and transportation indexes need to move in sync to confirm a trend.
 Why people admire him:
Creator of the Dow Jones Average. His integrity and relentless fact-finding made him a trusted voice. His theory became the blueprint for modern trend analysis.
 Richard D. Wyckoff (1873–1934)
Main focus: Supply & demand via price and volume.
Wyckoff saw the market as a battle between Smart Money and retail traders.
He split market cycles into Accumulation, Markup, Distribution, and Markdown.
His mission? To read Smart Money’s intentions by studying price and volume.
Why people admire him:
Wyckoff’s methods became core principles of technical analysis. His concepts of accumulation/distribution and focus on price–volume still guide traders today.
 Ralph Nelson Elliott (1871–1948)
Main focus: Human psychology in price charts.
Elliott discovered the market moves in a 5–3 wave structure (5 impulsive, 3 corrective).
He linked price action to fractals and Fibonacci ratios, seeing markets as part of nature’s rhythm.
Why people admire him:
He built one of the most comprehensive frameworks for market behavior. His ideas expanded beyond finance into psychology, sociology, and even culture (see socionomics).
 William Delbert Gann (1878–1955)
Main focus: Price, time, and geometry.
Gann loved using angles, cycles, and astronomy to predict turning points.
He believed markets follow “natural laws,” with price and time moving in harmony.
Why people admire him:
Gann wasn’t just a trader — he was a mathematician and mystic. From tape reading to his legendary forecasts, he showed markets reflect cosmic order.
 Arthur Merrill (1906–1885)
Main focus: Patterns and statistics.
Merrill tested whether chart patterns were real or just coincidences.
He created the Merrill Patterns — 16 core shapes showing investor psychology.
Why people admire him:
Dubbed the “First Citizen of Technical Analysis.” His research on cycles, ratios, and investor behavior shaped modern TA, especially through his book Behavior of Prices on Wall Street.
Some of his major contributions include:
- Author of Key Books: He wrote several influential books, including:
- Behavior of Prices on Wall Street (1984)
- Filtered Waves, Basic Theory (1977)
- Merrill on Market Cycles (1991)
- Quantitative Research: He was one of the first analysts to use computers to backtest the performance of various technical indicators and market patterns, moving the field away from pure chart interpretation towards statistical evidence.
- Market Cycles: A large part of his work focused on the analysis of stock market cycles and seasonality.
- CMT Designation: He is recognized as an important forebear of the Chartered Market Technician (CMT) program.
These five weren’t just chart watchers — they were system builders who shaped how we understand markets today.
Key Principles of Technical Analysis
Technical analysis is built on three foundational assumptions:
1. The Market Discounts Everything
Every known fact — earnings, news, interest rates — is already reflected in the price. The chart tells the full story.
2. Prices Move in Trends
Markets tend to move in uptrends, downtrends, or sideways ranges. Technical analysis aims to ride the trend until it ends.
3. History Repeats Itself
Because human behavior doesn’t change, chart patterns often repeat over time. That’s why traders look for familiar setups.
The Building Blocks of Technical Analysis
Let’s explore the essential tools every trader should understand.
1. Price Charts
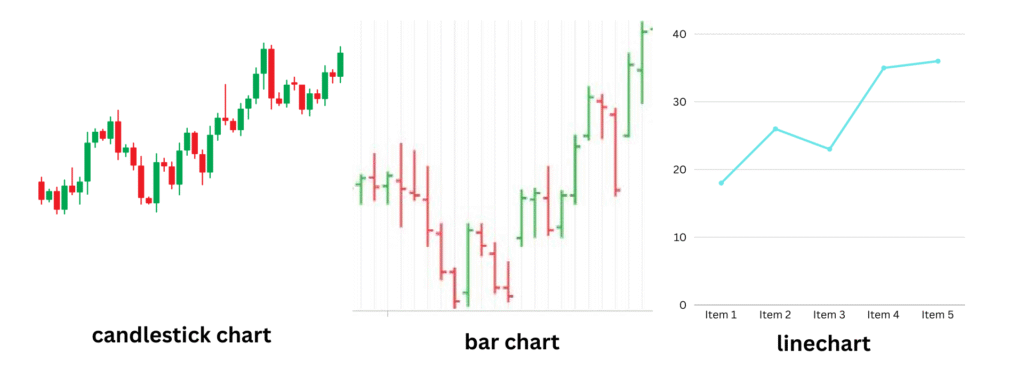
The chart is the trader’s battlefield. These are the most common types:
Line Chart: Simplest, connects closing prices.
Bar Chart: Shows open, high, low, and close (OHLC).
Candlestick Chart: The most popular—visually rich and intuitive.
Each candle or bar represents how price behaved during a specific period (e.g., 1 hour, 1 day).
2.  Trends and Trendlines
Trend is your friend—until it bends.
There are three main types of trends:
 Uptrend: Higher highs and higher lows
 Downtrend: Lower highs and lower lows
 Sideways: Horizontal price movement
Trendlines are drawn to connect swing highs or lows, helping you visually identify and follow the trend.
3. 🔁 Support and Resistance Levels
Support is where price tends to stop falling.
Resistance is where price tends to stop rising.
These levels act like floors and ceilings. Once broken, they often reverse roles (support becomes resistance and vice versa).
4. 📐 Chart Patterns
Patterns help traders anticipate market moves. They are divided into:
Reversal Patterns: Indicate a change in trend (e.g., Head & Shoulders, Double Top, Inverse Head & Shoulders).
Continuation Patterns: Signal the trend is likely to continue (e.g., Flags, Pennants, Triangles).
5. 📏 Indicators and Oscillators
These are mathematical tools derived from price and volume data. They help confirm trends or signal possible reversals.
Popular Indicators:
Moving Averages (SMA, EMA) – Smooth out price to identify trend direction.
Relative Strength Index (RSI) – Measures overbought or oversold conditions.
MACD (Moving Average Convergence Divergence) – Combines momentum and trend-following elements.
Bollinger Bands – Show volatility and potential price ranges.
Timeframes: Why They Matter
Every chart is tied to a timeframe—from 1-minute to monthly. The choice depends on your trading style:
Scalpers: 1–5 minute charts
Day traders: 5–30 minute charts
Swing traders: Daily or 4-hour charts
Investors: Weekly or monthly charts
Many professionals use multi-timeframe analysis, starting from a higher timeframe (“big picture”) and zooming into lower ones for entries.
Candlestick Patterns: The Language of Price Action
Each candlestick tells a story. Here are a few powerful patterns to know:
Doji: Market indecision
Hammer: Bullish reversal after a downtrend
Volume: The Fuel Behind the Move
Volume confirms price strength. A breakout with high volume is more reliable than one with weak volume.
Key volume concepts:
Volume Spikes: Often precede big moves.
Volume Divergence: Can warn of potential reversals.
Volume with Patterns: Helps validate breakouts or breakdowns.
Shooting Star: Bearish reversal after an uptrend
Engulfing Pattern: Strong reversal signal
Understanding candlestick psychology helps decode what buyers and sellers are doing.
How to Start Using Technical Analysis
[Suggested Image: Beginner trader looking at a candlestick chart on laptop]
Here’s how to get started:
✅ Learn chart basics: candles, trends, and support/resistance
✅ Choose a charting platform (e.g. TradingView)
✅ Start with one or two indicators (e.g. RSI + Moving Average)
✅ Practice spotting patterns on historical charts
✅ Use a demo account before trading real money
✅ Build and test a simple strategy
✅ Focus on consistency over complexity
Why Every Trader Should Know Technical Analysis
Technical analysis gives you an edge. It helps you see what the market is doing, rather than guessing based on opinions or news. Whether you’re a day trader or long-term investor, understanding price behavior and market psychology is invaluable.
And the best part? You don’t need a finance degree or years of experience. Just start with the basics, apply what you learn, and grow from there.
“Learn the chart, master the craft, and let the market speak.”