2026 Market Timing Report Year Ahead Special
The 2026 Master Roadmap: Navigating the Great Transformation Through Cycle Analysis
Welcome to a world where history acts as a precise GPS for your financial future. Most people view the economy as a chaotic series of random events, yet cycle analysis reveals a hidden, mathematical order beneath the surface. This report serves as your professional guide to the 2026 “Year Ahead,” translating complex data into a relaxed, actionable strategy for every investor. Consequently, we will explore why certain years feel like echoes of the past and how you can position yourself to thrive in the coming shifts. The Foundation of Mathematical Foreknowledge
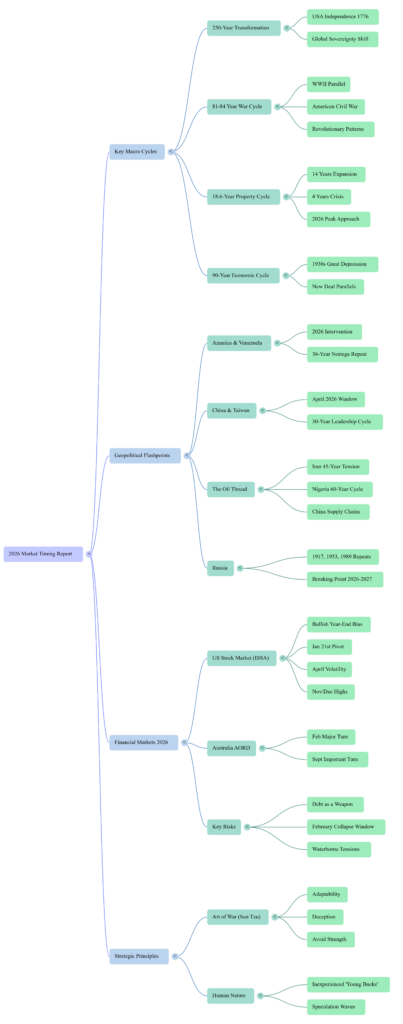
History never truly repeats, but it certainly rhymes with rhythmic precision. Our methodology relies on identifying these rhymes through various lenses, ranging from 10-year market ripples to massive 250-year societal shifts. To begin, we must recognize that we are currently living through a “Modern Day Revolution” that shifted the world from global cooperation to intense polarization. Furthermore, this transition follows the 82-to-84-year revolutionary cycle that previously brought us the rise of Hitler in 1933 and the European revolutions of 1848. One cycle back from our current moment leads to the 1930s, while two cycles back reveal the explosive social unrest of 1848. Crucially, the third cycle takes us to 1765 and the Stamp Act, which ignited the American Revolution. We even see the influence of the 500-year cycle, stretching back to 1517 when Martin Luther challenged the authority of the Pope. Because these cycles align now, disaffected populations across the globe are demanding radical change once again. America’s 250-Year Reckoning and the Venezuela Pivot
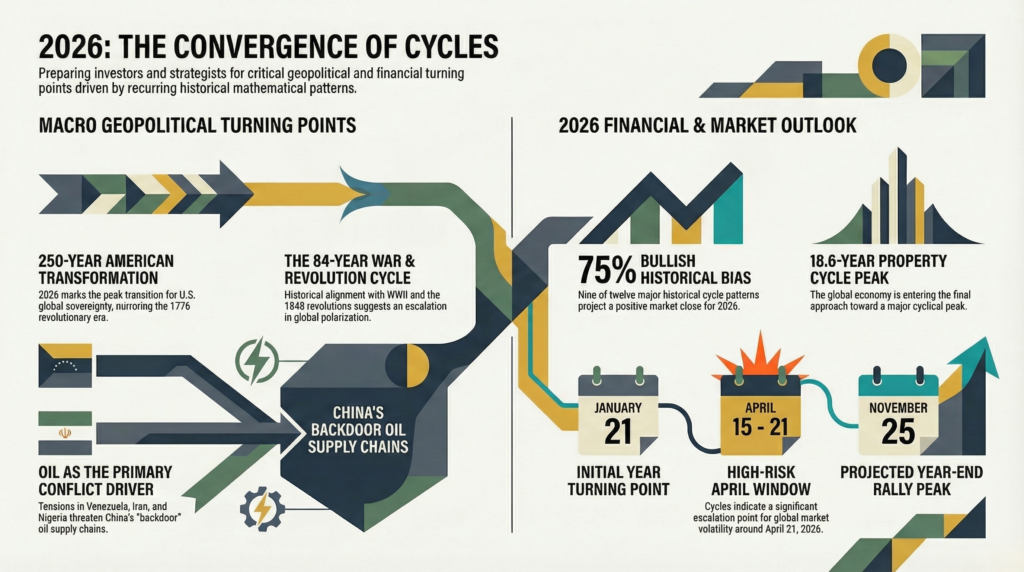
The United States of America is currently entering its most significant transition since its birth in 1776. Specifically, the 250-year transformation cycle has reached its peak, suggesting a total overhaul of the nation’s status and internal structure. On January 3, 2026, President Trump intervened in Venezuela, capturing Nicolás Maduro in a move that mirrored the capture of Manuel Noriega exactly 36 years prior. Similarly, New York City swore in its first Muslim and Asian American mayor on January 1, 2026, echoing the 1990 swearing-in of the city’s first African American mayor. These events prove that history repeats to the very day when the mathematical cycles align. Moreover, the 81-to-84-year revolution cycle is now merging with this 250-year transformation, signaling a tipping point for global sovereignty. Since 1941, the USA has ruled the world, but the cycles suggest this dominance is now facing an unprecedented challenge. Although the public reason for the Venezuela intervention was to stop drug trafficking, the underlying motive involves a much more valuable resource. Black Gold: The Lifeblood of Geopolitics
Oil remains the common thread tying together the world’s most volatile regions. Venezuela, Iran, and Nigeria serve as the primary suppliers of crude to China, which has been expanding its influence while the West was distracted. Additionally, China has secured rare earth minerals that the American tech sector desperately requires. When the U.S. imposed sanctions on Iran and Venezuela in 2018, China simply began importing their oil clandestinely via Malaysia. By 2024, approximately one in five barrels of Chinese oil came from sanctioned sources. This backdoor trade allowed Iran to regain its market share despite official figures suggesting otherwise. Therefore, the intervention in Venezuela is a direct move to disrupt China’s energy supply and secure the “South”. However, this proactive stance carries a high price, as it effectively tears up the global rulebook. Iran and the 45-Year Tension Cycle
Our analysis indicates that tensions with Iran are about to escalate significantly. This forecast stems from the 45-year cycle, which traces back to the 1981 release of American hostages just minutes after Ronald Reagan’s inauguration. Before that, the 1979 revolution had ended the pro-American era of the Shah and triggered the hostage crisis. Since we are exactly 45 years from that 1981 resolution, we should expect a new peak in hostility. Nigeria: The 60-Year Turning Point
Nigeria is another nation where cycle analysis predicts major regime changes. Looking back 72 years to 1953, we see the first major outbreaks of violence between the northern and southern factions. In 1966, exactly 60 years ago, a military coup deposed the government and led to the assassination of key leaders. Because this 60-year cycle is now active, we may see an American-backed administration installed to secure Nigeria’s massive oil deposits. The Precedent for Global Conflict: Taiwan and Beyond
The unilateral intervention in Venezuela has opened a dangerous door. If the United States can take control of a sovereign nation to protect its interests, other powers will feel entitled to do the same. Consequently, China may feel emboldened to move on Taiwan, viewing the current global instability as a perfect window of opportunity. Our data suggests a critical flashpoint window around April 21, 2026, when Taiwan could come under direct attack. Historic cycles show that American forces bombed Taiwan in 1944 during the 81-to-84-year war cycle. Furthermore, the 30-year cycle points to 1996, which was a milestone year for Taiwanese democracy. Since the 30-year cycle is particularly potent in communist-connected regions, we expect a major change in leadership or status for Taiwan this year. Personal Cycles: The “Art of the Deal” at Age 80
Donald Trump’s personal cycles will heavily influence global affairs in 2026. As he approaches age 80, his behaviors may become more impulsive and personal. Specifically, the dates of February 5th and 6th, March 1st, and April 8th are high-intensity trigger points for unexpected news. While he continues to play his signature strategy in global politics, his health and well-being could also face challenges during these windows. The Return of the Collapse Cycle: Lessons from 1846 and 2008
Financial markets are not immune to these rhythmic pulses of history. February 2026 stands out as a peak window for potential financial scandals or collapses. This forecast is based on the 18-year cycle, which traces back to the 2008 Global Financial Crisis. In 2008, the collapse of Northern Rock in February served as the first “falling card” in a massive house of cards.However, the patterns go even deeper into the past. Two 90-year cycles back, in 1846, Britain experienced the “Railway Mania” bust. In the years prior, a golden age of recovery and easy money led people to jump onto the railway boom with only 10% down payments. By late 1845, the boom turned to “collective hallucination,” according to the press at the time. Subsequently, a potato crop failure and rising interest rates triggered a massive panic. Because we are seeing similar patterns of over-optimism and boom-bust behavior today, we must be prepared for a sharp correction. The 18.6-Year Property Cycle: The Governing Rhythm
The 18.6-year cycle is perhaps the most important economic rhythm for investors to understand. It has driven every major boom and bust period in the United States since at least 1800. The structure is remarkably consistent: 14 years of expansion (split by a mid-cycle slowdown) followed by a 4-year crisis phase. Currently, we are approaching the final peak of the cycle that began in 2012. The massive stimulus following the 2019 slowdown pushed the second half of this cycle forward. Nevertheless, the next 12 to 24 months should bring a major economic crisis as the system resets for a new cycle. Understanding your position in this cycle is the key to trading with clarity and safety. All major asset classes—from stocks and real estate to Bitcoin and gold—follow this underlying pulse. Russia’s Breaking Point: 1917, 1953, 1989, and 2026
Russia is currently facing a critical turning point that will play out over the next two years. This prediction relies on the 36-year cycle of Russian transformation. In 1989, the Berlin Wall fell, leading to the breakup of the Soviet Union. Thirty-six years before that, in 1953, the death of Joseph Stalin ended an era of paranoia and dictatorship. Moving back another 36 years takes us to the 1917 Bolshevik Revolution, which ended centuries of Romanov rule. Because these 36-year cycles are so consistent, Russia is likely at a “breaking point” where the current regime faces internal or external collapse. History proves that wars break out every 20 to 25 years because human nature never changes. A new generation, full of hope and inexperienced in the bitterness of war, is always ready to fight. Currently, the leaders of the world’s largest nations—Trump, Putin, and Xi—are all in their 70s and have never lived through a conflict of World War II’s magnitude. Market Predictions for 2026: The Bullish Bias
Despite the geopolitical turmoil, our proprietary modeling suggests that the stock market may surprise many observers. We examined 12 different historical patterns, including 10, 20, 30, and up to 120-year cycles. Out of these 12 patterns, seven close the year up, while only three close down. Tmhe 10, 20, 30, and 40-year cycles all show a positive year-end. Specifically, the “Decennial Pattern” based on 125 years of data shows that years ending in “6” are predominantly bullish. While they are not as strong as years ending in “5,” they still favor a move up by the end of the year. Our coarse modeling for the Dow Jones Industrial Average (DJIA) suggests a rally into late 2026. Key Turning Points for the Australian Market
For our friends in Australia, the AORD Index has its own set of critical dates. You should expect major turns during the weeks ending January 30th and February 20th. Other important windows include May 1st, September 4th, and October 16th. These dates represent moments when the market’s geometry aligns with cycle peaks, offering high-probability trading opportunities. W.D. Gann’s Financial Timetable: The Neutral Signal
The legendary forecaster W.D. Gann created a “Financial Timetable” in 1909 that has proven uncannily accurate for over a century. Interestingly, the timetable has no specific notations for the year 2026. In our system, this absence of data suggests a neutral year where no major, pre-determined “panic” or “prosperity” label applies. However, our higher-order histogram modeling still points toward a bullish resolution after initial volatility. The Old Truth: Wisdom from The Art of War
As we head into this physical conflict window, we must remember the principles of Sun Tzu. The ultimate victory is to subdue the enemy without combat, a strategy China has used effectively through economic expansion. Investing and trading require these same martial skills: knowing when to fight, attacking weakness, and being flexible like water. A good leader, or a good trader, avoids recklessness and a hasty temper. War is a grave matter that is always expensive and detrimental if prolonged. Whether our global leaders will heed this caution remains to be seen, but the cycles suggest they are currently in “young buck” mode, ready for a fight. Therefore, your priority must be to protect your capital and stay safe during these turbulent times.
How to Act: Your Professional Action Plan
With so much uncertainty, you might wonder how to practically use this information. We recommend a disciplined, systematic approach to manage your risk. First, if you are in doubt about a market move, simply stay out. Second, wait for a strong weekly or daily “PFO” (Proprietary Forecast) date to provide an anchor. Observation is your most powerful tool; watch what the market does as it leaves these specific dates. Then, use the geometry taught in our system to identify your entry and exit points. By combining cycle analysis with precise risk management, you create a profitable system that doesn’t rely on guesswork. Conclusion: Forewarned is Forearmed
The year 2026 will be remembered as a major tipping point in human history. We are witnessing the 250-year transformation of America, the 18.6-year peak of the property cycle, and the 84-year return of global revolution. While the geopolitical landscape appears terrifying, the mathematical cycles offer a roadmap to navigate the storm. Most patterns suggest the markets will end the year higher, but the volatility between now and then will be extreme. Stay focused on the key turning points, respect the power of the oil and debt cycles, and never ignore the lessons of 1846 or 1917. Our mission is to keep you ahead of the game by showing you what to trade, when to trade, and how to trade it. Wishing you a healthy, prosperous, and safe 2026. Remember: “The thing that hath been, it is that which shall be… and there is no new thing under the sun”. Use these cycles to your advantage, and you will find opportunity where others only find chaos. This comprehensive summary functions exclusively as an educational resource designed to explore the historical rhymes discovered through cycle analysis. Consequently, the writer and publisher disclaim all responsibility or accountability for any personal financial decisions made based on this content. Finally, please approach this data from a neutral and objective standpoint to ensure grasping the larger historical roadmap without bias
The 2026 Master Roadmap: Navigating the Great Transformation Through Cycle Analysis
Welcome to a world where history acts as a precise GPS for your financial future. Most people view the economy as a chaotic series of random events, yet cycle analysis reveals a hidden, mathematical order beneath the surface. This report serves as your professional guide to the 2026 “Year Ahead,” translating complex data into a relaxed, actionable strategy for every investor. Consequently, we will explore why certain years feel like echoes of the past and how you can position yourself to thrive in the coming shifts.
The Foundation of Mathematical Foreknowledge
History never truly repeats, but it certainly rhymes with rhythmic precision. Our methodology relies on identifying these rhymes through various lenses, ranging from 10-year market ripples to massive 250-year societal shifts. To begin, we must recognize that we are currently living through a “Modern Day Revolution” that shifted the world from global cooperation to intense polarization. Furthermore, this transition follows the 82-to-84-year revolutionary cycle that previously brought us the rise of Hitler in 1933 and the European revolutions of 1848.
One cycle back from our current moment leads to the 1930s, while two cycles back reveal the explosive social unrest of 1848. Crucially, the third cycle takes us to 1765 and the Stamp Act, which ignited the American Revolution. We even see the influence of the 500-year cycle, stretching back to 1517 when Martin Luther challenged the authority of the Pope. Because these cycles align now, disaffected populations across the globe are demanding radical change once again.
America’s 250-Year Reckoning and the Venezuela Pivot
The United States of America is currently entering its most significant transition since its birth in 1776. Specifically, the 250-year transformation cycle has reached its peak, suggesting a total overhaul of the nation’s status and internal structure. On January 3, 2026, President Trump intervened in Venezuela, capturing Nicolás Maduro in a move that mirrored the capture of Manuel Noriega exactly 36 years prior. Similarly, New York City swore in its first Muslim and Asian American mayor on January 1, 2026, echoing the 1990 swearing-in of the city’s first African American mayor.
These events prove that history repeats to the very day when the mathematical cycles align. Moreover, the 81-to-84-year revolution cycle is now merging with this 250-year transformation, signaling a tipping point for global sovereignty. Since 1941, the USA has ruled the world, but the cycles suggest this dominance is now facing an unprecedented challenge. Although the public reason for the Venezuela intervention was to stop drug trafficking, the underlying motive involves a much more valuable resource.
Black Gold: The Lifeblood of Geopolitics
Oil remains the common thread tying together the world’s most volatile regions. Venezuela, Iran, and Nigeria serve as the primary suppliers of crude to China, which has been expanding its influence while the West was distracted. Additionally, China has secured rare earth minerals that the American tech sector desperately requires. When the U.S. imposed sanctions on Iran and Venezuela in 2018, China simply began importing their oil clandestinely via Malaysia.
By 2024, approximately one in five barrels of Chinese oil came from sanctioned sources. This backdoor trade allowed Iran to regain its market share despite official figures suggesting otherwise. Therefore, the intervention in Venezuela is a direct move to disrupt China’s energy supply and secure the “South”. However, this proactive stance carries a high price, as it effectively tears up the global rulebook.
Iran and the 45-Year Tension Cycle
Our analysis indicates that tensions with Iran are about to escalate significantly. This forecast stems from the 45-year cycle, which traces back to the 1981 release of American hostages just minutes after Ronald Reagan’s inauguration. Before that, the 1979 revolution had ended the pro-American era of the Shah and triggered the hostage crisis. Since we are exactly 45 years from that 1981 resolution, we should expect a new peak in hostility.
Nigeria: The 60-Year Turning Point
Nigeria is another nation where cycle analysis predicts major regime changes. Looking back 72 years to 1953, we see the first major outbreaks of violence between the northern and southern factions. In 1966, exactly 60 years ago, a military coup deposed the government and led to the assassination of key leaders. Because this 60-year cycle is now active, we may see an American-backed administration installed to secure Nigeria’s massive oil deposits.
The Precedent for Global Conflict: Taiwan and Beyond
The unilateral intervention in Venezuela has opened a dangerous door. If the United States can take control of a sovereign nation to protect its interests, other powers will feel entitled to do the same. Consequently, China may feel emboldened to move on Taiwan, viewing the current global instability as a perfect window of opportunity. Our data suggests a critical flashpoint window around April 21, 2026, when Taiwan could come under direct attack.
Historic cycles show that American forces bombed Taiwan in 1944 during the 81-to-84-year war cycle. Furthermore, the 30-year cycle points to 1996, which was a milestone year for Taiwanese democracy. Since the 30-year cycle is particularly potent in communist-connected regions, we expect a major change in leadership or status for Taiwan this year.
Personal Cycles: The “Art of the Deal” at Age 80
Donald Trump’s personal cycles will heavily influence global affairs in 2026. As he approaches age 80, his behaviors may become more impulsive and personal. Specifically, the dates of February 5th and 6th, March 1st, and April 8th are high-intensity trigger points for unexpected news. While he continues to play his signature strategy in global politics, his health and well-being could also face challenges during these windows.
The Return of the Collapse Cycle: Lessons from 1846 and 2008
Financial markets are not immune to these rhythmic pulses of history. February 2026 stands out as a peak window for potential financial scandals or collapses. This forecast is based on the 18-year cycle, which traces back to the 2008 Global Financial Crisis. In 2008, the collapse of Northern Rock in February served as the first “falling card” in a massive house of cards.
However, the patterns go even deeper into the past. Two 90-year cycles back, in 1846, Britain experienced the “Railway Mania” bust. In the years prior, a golden age of recovery and easy money led people to jump onto the railway boom with only 10% down payments. By late 1845, the boom turned to “collective hallucination,” according to the press at the time. Subsequently, a potato crop failure and rising interest rates triggered a massive panic. Because we are seeing similar patterns of over-optimism and boom-bust behavior today, we must be prepared for a sharp correction.
The 18.6-Year Property Cycle: The Governing Rhythm
The 18.6-year cycle is perhaps the most important economic rhythm for investors to understand. It has driven every major boom and bust period in the United States since at least 1800. The structure is remarkably consistent: 14 years of expansion (split by a mid-cycle slowdown) followed by a 4-year crisis phase. Currently, we are approaching the final peak of the cycle that began in 2012.
The massive stimulus following the 2019 slowdown pushed the second half of this cycle forward. Nevertheless, the next 12 to 24 months should bring a major economic crisis as the system resets for a new cycle. Understanding your position in this cycle is the key to trading with clarity and safety. All major asset classes—from stocks and real estate to Bitcoin and gold—follow this underlying pulse.
Russia’s Breaking Point: 1917, 1953, 1989, and 2026
Russia is currently facing a critical turning point that will play out over the next two years. This prediction relies on the 36-year cycle of Russian transformation. In 1989, the Berlin Wall fell, leading to the breakup of the Soviet Union. Thirty-six years before that, in 1953, the death of Joseph Stalin ended an era of paranoia and dictatorship. Moving back another 36 years takes us to the 1917 Bolshevik Revolution, which ended centuries of Romanov rule.
Because these 36-year cycles are so consistent, Russia is likely at a “breaking point” where the current regime faces internal or external collapse. History proves that wars break out every 20 to 25 years because human nature never changes. A new generation, full of hope and inexperienced in the bitterness of war, is always ready to fight. Currently, the leaders of the world’s largest nations—Trump, Putin, and Xi—are all in their 70s and have never lived through a conflict of World War II’s magnitude.
Market Predictions for 2026: The Bullish Bias
Despite the geopolitical turmoil, our proprietary modeling suggests that the stock market may surprise many observers. We examined 12 different historical patterns, including 10, 20, 30, and up to 120-year cycles. Out of these 12 patterns, seven close the year up, while only three close down. Tmhe 10, 20, 30, and 40-year cycles all show a positive year-end.
Specifically, the “Decennial Pattern” based on 125 years of data shows that years ending in “6” are predominantly bullish. While they are not as strong as years ending in “5,” they still favor a move up by the end of the year. Our coarse modeling for the Dow Jones Industrial Average (DJIA) suggests a rally into late 2026.
Key Turning Points for the Australian Market
For our friends in Australia, the AORD Index has its own set of critical dates. You should expect major turns during the weeks ending January 30th and February 20th. Other important windows include May 1st, September 4th, and October 16th. These dates represent moments when the market’s geometry aligns with cycle peaks, offering high-probability trading opportunities.
W.D. Gann’s Financial Timetable: The Neutral Signal
The legendary forecaster W.D. Gann created a “Financial Timetable” in 1909 that has proven uncannily accurate for over a century. Interestingly, the timetable has no specific notations for the year 2026. In our system, this absence of data suggests a neutral year where no major, pre-determined “panic” or “prosperity” label applies. However, our higher-order histogram modeling still points toward a bullish resolution after initial volatility.
The Old Truth: Wisdom from The Art of War
As we head into this physical conflict window, we must remember the principles of Sun Tzu. The ultimate victory is to subdue the enemy without combat, a strategy China has used effectively through economic expansion. Investing and trading require these same martial skills: knowing when to fight, attacking weakness, and being flexible like water. A good leader, or a good trader, avoids recklessness and a hasty temper.
War is a grave matter that is always expensive and detrimental if prolonged. Whether our global leaders will heed this caution remains to be seen, but the cycles suggest they are currently in “young buck” mode, ready for a fight. Therefore, your priority must be to protect your capital and stay safe during these turbulent times.
How to Act: Your Professional Action Plan
With so much uncertainty, you might wonder how to practically use this information. We recommend a disciplined, systematic approach to manage your risk. First, if you are in doubt about a market move, simply stay out. Second, wait for a strong weekly or daily “PFO” (Proprietary Forecast) date to provide an anchor.
Observation is your most powerful tool; watch what the market does as it leaves these specific dates. Then, use the geometry taught in our system to identify your entry and exit points. By combining cycle analysis with precise risk management, you create a profitable system that doesn’t rely on guesswork.
Conclusion: Forewarned is Forearmed
The year 2026 will be remembered as a major tipping point in human history. We are witnessing the 250-year transformation of America, the 18.6-year peak of the property cycle, and the 84-year return of global revolution. While the geopolitical landscape appears terrifying, the mathematical cycles offer a roadmap to navigate the storm.
Most patterns suggest the markets will end the year higher, but the volatility between now and then will be extreme. Stay focused on the key turning points, respect the power of the oil and debt cycles, and never ignore the lessons of 1846 or 1917. Our mission is to keep you ahead of the game by showing you what to trade, when to trade, and how to trade it.
Wishing you a healthy, prosperous, and safe 2026. Remember: “The thing that hath been, it is that which shall be… and there is no new thing under the sun”. Use these cycles to your advantage, and you will find opportunity where others only find chaos.
This comprehensive summary functions exclusively as an educational resource designed to explore the historical rhymes discovered through cycle analysis. Consequently, the writer and publisher disclaim all responsibility or accountability for any personal financial decisions made based on this content. Finally, please approach this data from a neutral and objective standpoint to ensure grasping the larger historical roadmap without bias